All trademarks are properties of their respective owners.
Somewhere around 2011, the game of golf collided with Moneyball to move away from traditional counting stats and into the world of advanced analytics. The “Billy Beane” (Oakland A’s GM, 1997-2015) of golf is generally thought of as Mark Broadie, a Columbia Business School professor who introduced the Strokes Gained (SG) metric. And no doubt it was on full display at the 2025 Masters.
Going into the weekend, Rory McIlroy was ranked #1 in Strokes Gained according to datagolf.com. But how did he pull off the win in just one playoff hole? Everyone saw the putt go in, but the real work by Rory was done prior to that. Strokes Gained data shows just how severely outmatched Justin Rose was by Rory in his shots from 100 yards or more (see green table spotlights) – a 1.55 stroke differential.
Strokes Gained for Golfers and Companies
What is Strokes Gained? The stat tells you many shots a player saved or lost on each part of their golf game – driving (off the tee), iron shots (approach), chipping (around the green), and putting (on the green) – compared to the average pro golfer. The benefit to the golfer is that instead of just counting birdies and bogeys, Strokes Gained shows where you are beating the field – and where you’re falling behind.
At wRatings, we breakdown a company’s performance in a similar way by showing where they are beating their rivals and where they are falling behind – as compared to where customers expect them to be. A company’s Value Gap – similar to Strokes Gained for a golfer – can then be broken down into its components to create a laser beam focus on where to improve. This focus saves companies and golfers both time and money, all while accelerating their path to winning.
Let’s dig into the details with a few examples.
Where The Money Is: Drive for Show, Putt for Dough?
A stat becomes much more interesting and relevant when it makes you money. One measure that Mark Broadie uses is money earned per event (MPE), which is how much “green” a player generates. In 2019, the top 10 players ranked in proximity to the hole averaged $69k per event according to Broadie. But those in the top 10 for Strokes Gained, on approach shots averaged $164k. That’s a ~138% increase. If you expanded to the top 12, the MPE jumped to $211k, a whopping ~206% increase.
The Strokes Gained metric has the ability to help golfers focus on where to improve their game. A long-time assumption in the game has been to “drive for show, putt for dough.” But on average, the putting differential for golfers who shoot 70 versus 80 is 1.5 strokes. The differential increases to 6.5 strokes when you look at the Strokes Gained from 100 yards and out.
Looking the 2025 Top 10 players at The Masters, a similar set of analytics pans out. The gold table highlights show a much larger differential in Strokes Gained in Ballstrikes (App+OTT) for players, more than 1 point on average than the short game. In other words, players are much more similar when it comes to putting and chipping – driving and iron shots are what makes the difference.
The old adage needs to be reversed: Golfers drive for dough and putt for show.
Where The Money Is: Growth Contribution
In 2003, Bain & Company consultant Fred Reichheld created the Net Promoter Score® (NPS) in collaboration with Satmetric Systems. He introduced the concept in his Harvard Business Review article titled “The One Number You Need to Grow,” by asking one simple question: “How likely are you to recommend a company to a friend or colleague?”. The NPS metric has been widely adopted by companies all over the world.
With its Promoters, Passives, and Detractor groups, NPS is just like counting bogeys and birdies to see who won. They all add up nicely but they don’t provide any perspective on how the round was played – or where to focus to improve. Broadie created Strokes Gained to put each and every shot into context, allowing anyone to measure a player’s performance against their peers and build a select view of various aspects of their game.
The equivalent of Strokes Gained for a company is their Value Gap. The metric is based on the average gap size between what customers expect and what companies deliver, using a consistent framework of functional and emotional need concepts. In the late 1990s, our journey to figure out what contributes to revenue/margin growth began with 60+ functional and 240+ emotional needs. Over the next decade, we’ve whittled them down to just 12 functional and 5 emotional needs that are predictive of a company’s financial growth.
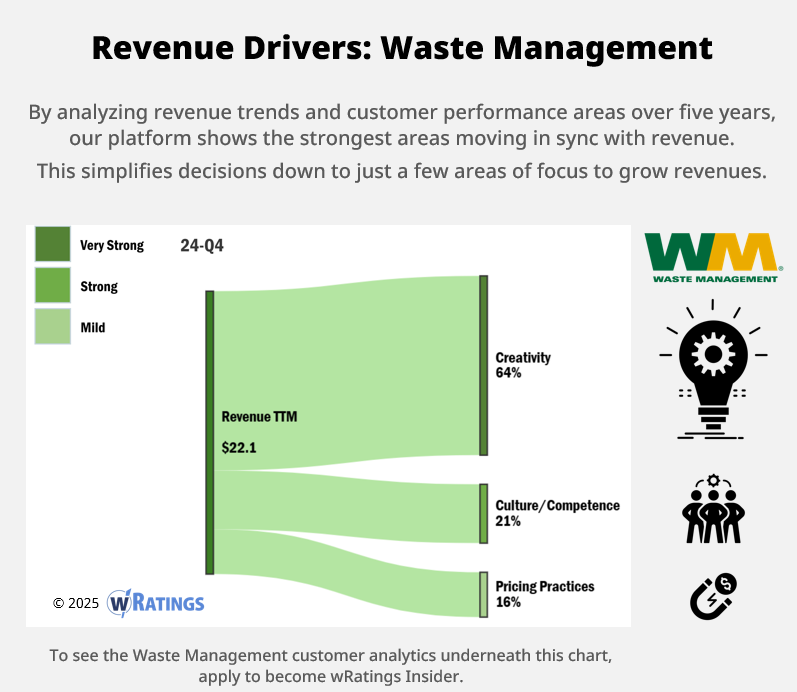
Waste Management (NYSE: WM) is one of our benchmark companies and included in our W-30 Index. Going back to 2020, we analyzed revenue trends and customer performance in both functional and emotional needs to detect any patterns. Just three performance areas are moving in sync with revenue: Creativity, Culture/Competence, and Pricing Practices. Of those three, Creativity is driving almost 2/3rds (64%) of WM’s revenue at the end of 2024.
Putting this into context for WM executives, focusing efforts to improve Creativity would yield the highest return on investment (ROI). They should also consider reducing or eliminating efforts outside of these three areas, if cost cutting was a primary objective in the near term.
What could WM do for customers to deliver more value in Creativity? Looking at WM customer analytics in our Moat Profiles, Creativity is most tied to three moats: Design Dominance, Distinct Innovation, and Routine Reliance. While WM may want to dig into any of the three for more value, WM is best positioned today to further build a moat barrier around its customers in Routine Reliance. Well-known companies such as Starbucks (NASDAQ: SBUX) and Intuit (NASDAQ: INTU) provide strong examples of how to build their offerings into customer schedules for this moat.
Find Your Revenue Drivers
While it’s commendable to try to “work on everything” to improve, short-cuts exist to accelerating revenue growth. You just need to know where to look. Let the wRatings platform show you the customer analytics that will contribute most to your company’s revenue and margin growth.