Predicting Winners in Baseball Teams vs Corporate Sales Growth
Jon Moritz
March 24, 2025
Predicting Winners in Baseball Teams & Corporate Sales Growth
Gary A. Williams
wRatings Founder & CEO

All trademarks are properties of their respective owners.
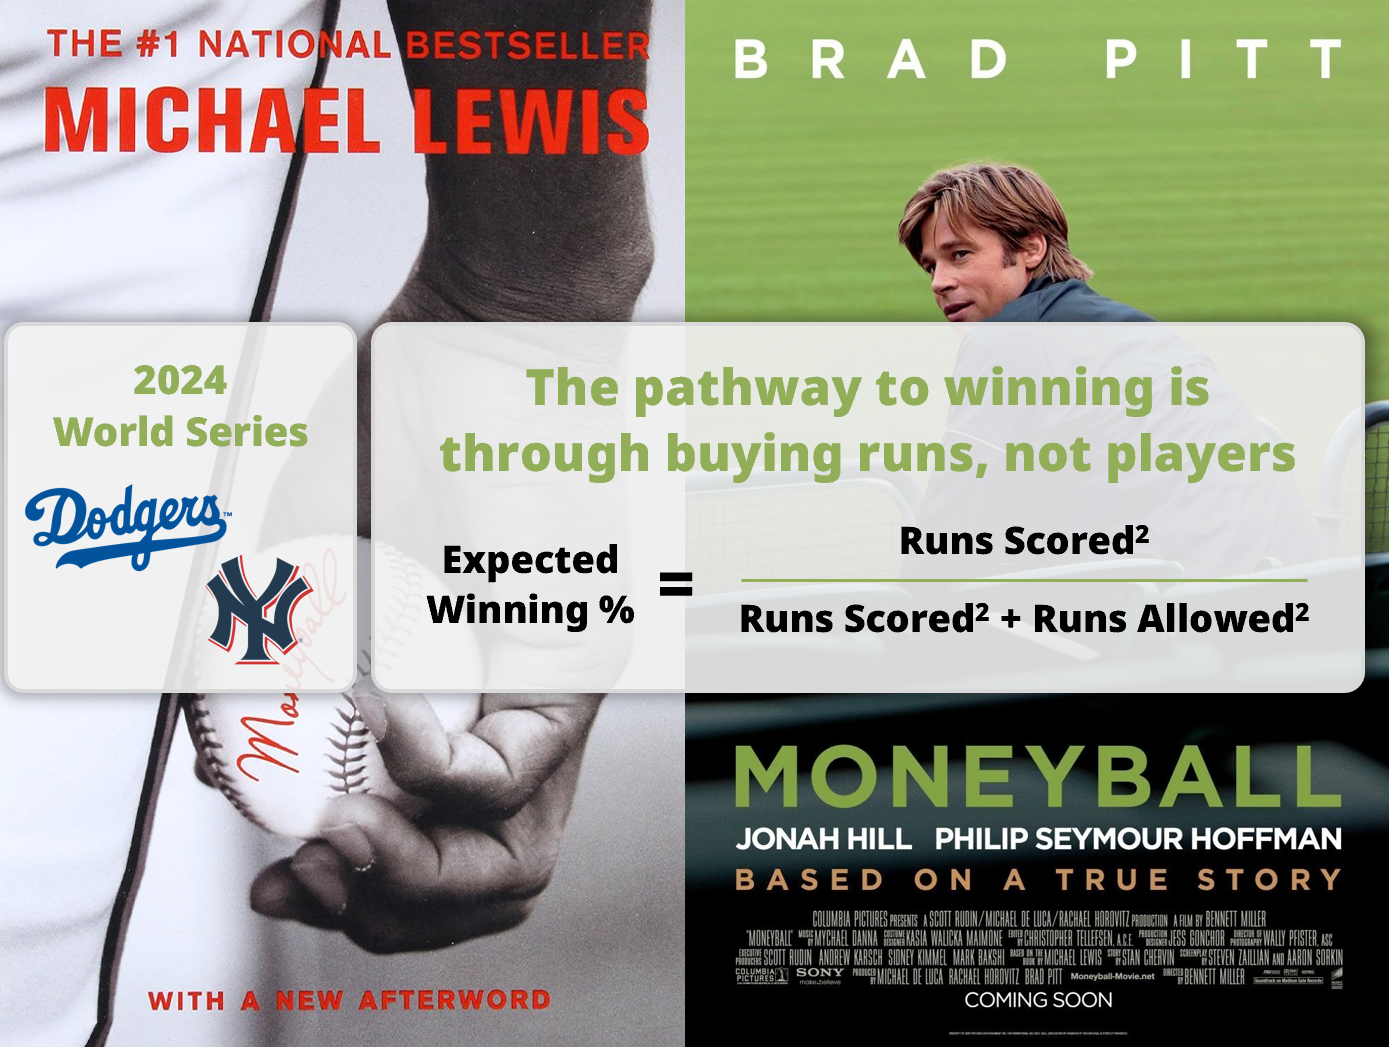
While most of us have heard of the Moneyball movie starring Brad Pitt and the Michael Lewis book of the same name, few know just how transformative it has been to baseball and many other sports. Moneyball changed the way baseball owners and General Managers thought about their teams with a single foundational concept: The pathway to winning is through buying runs, not players. With this new decision framework, teams are now able to identify undervalued areas of the game and players often overlooked by conventional thinking.
Similarly, most companies today try to grow sales using outdated metrics such as Net Promoter Score® and customer satisfaction. The pathway to winning in sales is not through a customer’s willingness to recommend, but through a customer’s willingness to pay. Successful executives today base their growth decisions on a new framework centered around customer expectations. This view replaces rear-view mirror metrics with a compelling, forward-looking analysis of how to win more customers.
Let’s dig into the metrics to see how predicting winners in baseball and corporate sales share a lot in common.
Moneyball and the 2024 World Series
The Moneyball formula, invented by statistician Bill James, is quite simple. By calculating the Runs Scored2 and then dividing it by the Runs Scored2 plus Runs Allowed2, you get an Expected Win % of games for the baseball season.
In the 2024 season, the top two teams expected to win the most games were Los Angeles Dodgers and the New York Yankees with Expected Win %’s of 60.1% and 59.8%, respectively. Of the 30 MLB teams, these ranked as the top two winning percentages. Translating this to the full season, each team had expected wins of 97.4 and 96.9, and their actual win totals were 98 and 94 games.
But how about the post season? Well, the 2024 World Series pitted the Dodgers against the Yankees. And the Dodgers won it all. In other words, the Moneyball formula worked.
Of course, the formula doesn’t hold true every season nor for every team. For example, the other playoff teams this season were the Cleveland Guardians and the New York Mets, which were ranked #8 and #13 from the thirty total MLB teams.

But the real power of Moneyball is not just in predicting winners. The analytics help owners and GMs build their teams with players most likely to win. They are able to identify undervalued areas of the game and players overlooked by conventional thinking. Every baseball team today uses some form of Moneyball to build and manage their team.
Moneyball for Corporate Sales Growth
Rather than focusing on whole players, baseball decision-makers now look at the distinct elements of how each game is won. Breaking a game down into runs scored and runs allowed provides a much deeper assessment of where to focus their investments.
For decades, executives have been told all they need to do to grow sales is satisfy customers. Yet, numerous examples exist of companies with satisfied customers that have gone out of business or exist in brand name only: A&P Supermarket, Blackberry, Blockbuster, Borders, Circuit City, Compaq, Polaroid, Ringling Brothers, Sears, Toys R Us.
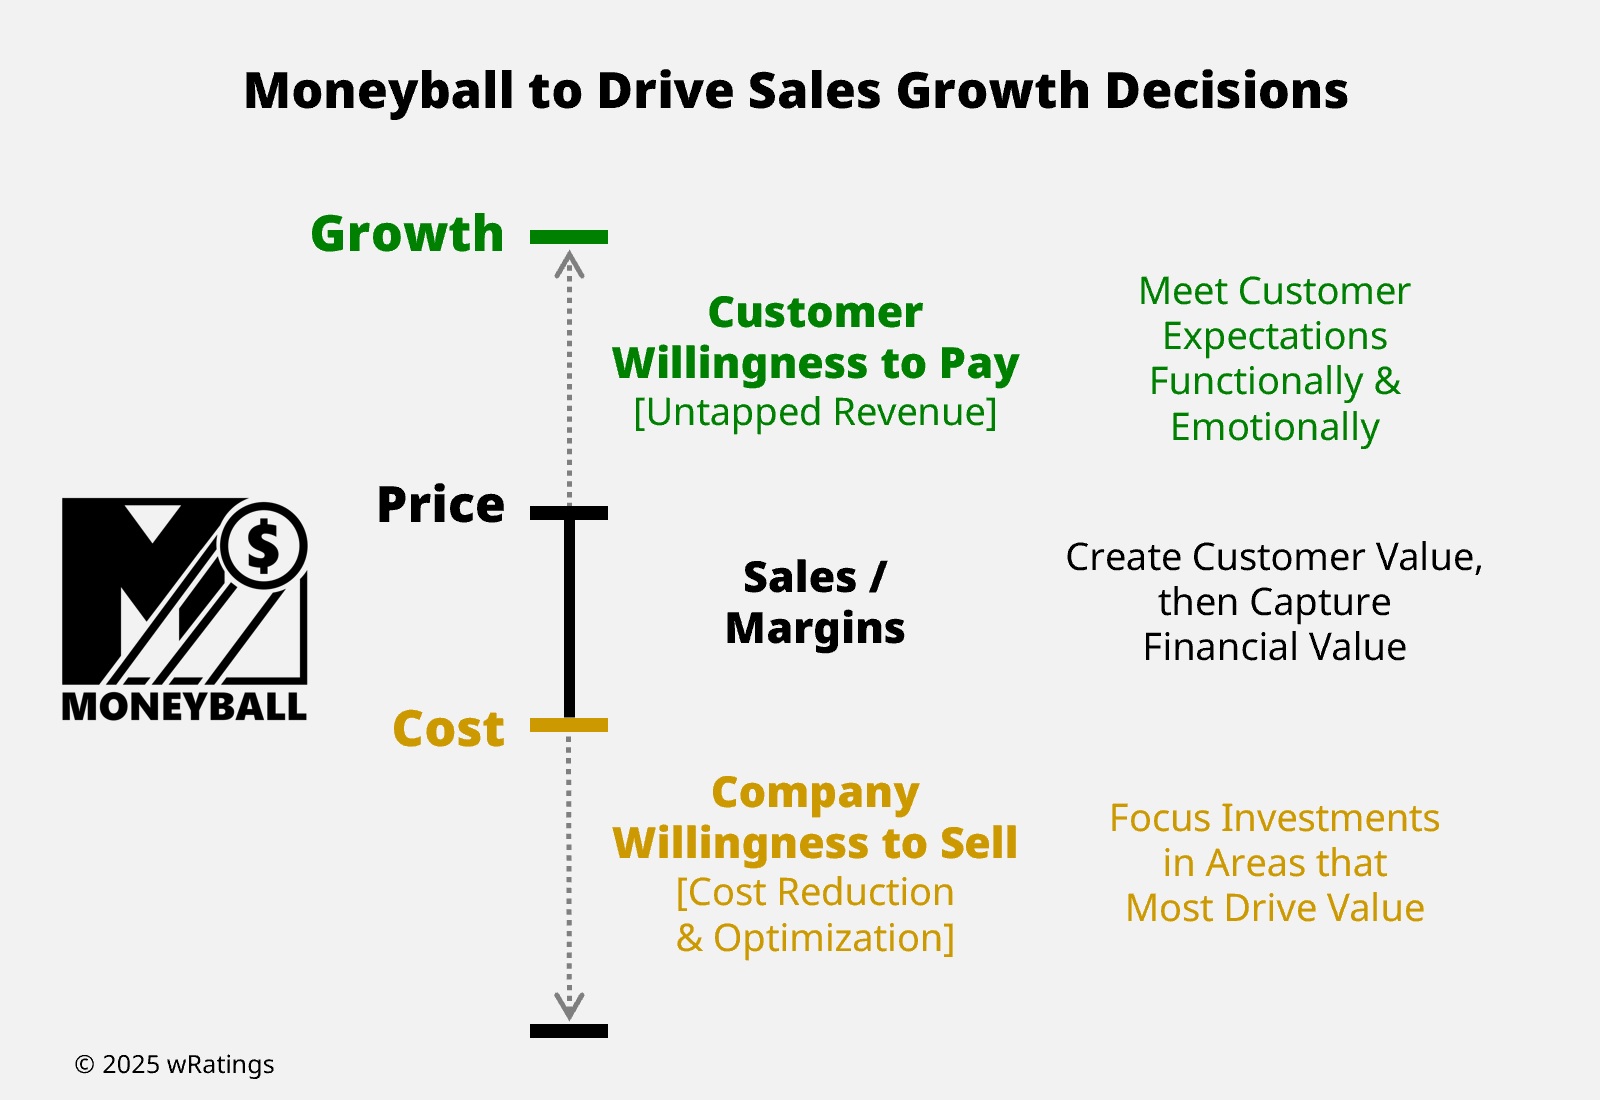
Today, many companies use some variation of customer satisfaction levels to drive decision-making. This often takes the form of Net Promoter Score®, where customers are asked about their willingness to recommend a company to others. But recommendations provide little to no indication of whether that customer will continue to buy. The goal isn’t willingness to recommend, it’s about a customer’s willingness to pay. Winning requires getting customers to put their money where their mouth is – and spending more.

So what drives a customer’s willingness to pay (WTP)? Meeting their expectations better than any other competitors. The formula to sales growth is that simple. Customer expectations come in the form of both functional and emotional needs. Be the company that best meets them, and customers will pay and spend more with you than with your rivals.
Executives can measure this using a Moneyball Stick, where customers evaluate the importance and intensity levels desired across multiple needs, and how well a company is performing to meet those expectations. The difference is called a Value Gap. The smaller this gap, the higher a customer’s willingness to pay. And the more customer value a company creates, the more sales and margin growth a company captures. Using our W-30 index of companies, the top half generating the most customer value (smallest gaps) consistently outperform the bottom half when measuring Willingness to Pay (WTP), Sales Growth, and Gross Margins.
Moneyball isn’t just for sports owners and GMs; It’s for corporate executives and their sales teams.
If you’d like access the analytics in our W-30 benchmarks, apply to become a wRatings Insider.
© 1999-2025 wRatings. All rights reserved / Privacy Policy


