March Madness: Duke in Lockstep with the Dodgers & Delta Air Lines
Gary A Williams
April 1, 2025
March Madness: Duke in lockstep with the Dodgers & Delta Air Lines
Gary A. Williams
wRatings Founder & CEO

All trademarks are properties of their respective owners.
While Bill James may be the godfather of Moneyball analytics for baseball, former weatherman Ken Pomeroy is the college basketball (CBB) guru most known for its advanced metrics today. Pomeroy launched his blog site back in 1999, several years before the Oakland Athletics put Moneyball to good use. Leaning heavily on Dean Oliver’s “Basketball on Paper” book, he published his first set of data right before NCAA March Madness in 2004.
Winners & Analytics
How well do the KenPom rankings work? In the past 20+ years, every CBB champion except for one (2014) has been in the top 10 overall. UConn won it all in 2023 and 2024; They were also ranked #1 in both seasons by KenPom. And this week in 2025, the four teams in the Final Four just so happen to be the top 4 ranked n KenPom.
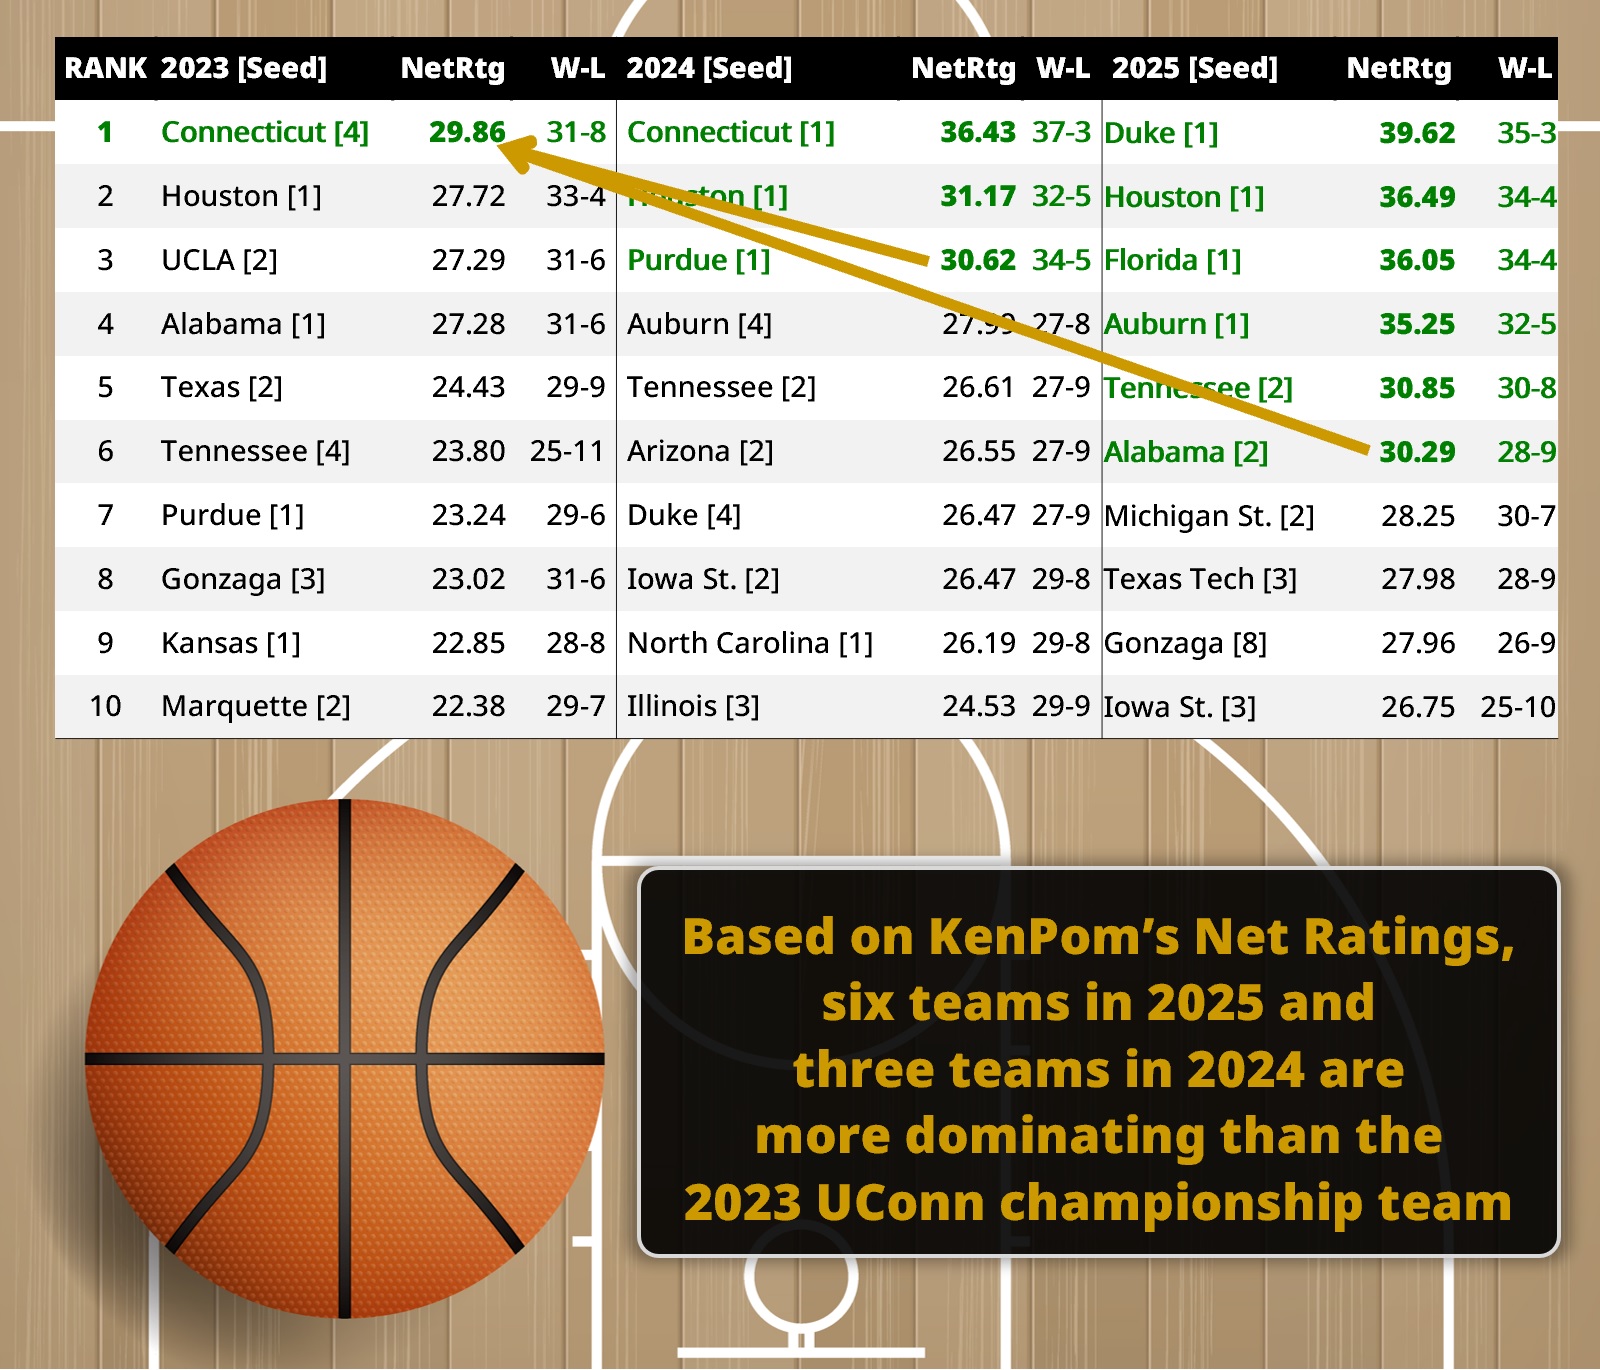
But here is what is astounding: Looking back at the best teams on KenPom since they debuted in 2002, Duke has the highest NetRating (39.62) of any team in any season. So based on analytics, this 2025 Duke team would beat any of the national champions since 2002. Wow.
No doubt NIL money is driving a lot of this performance. A WSJ article drills into the secret group behind Duke Basketball this season.
And with so much money at risk, Moneyball concepts have permeated every major sport where advertising, betting, and winning are involved. The concepts are descriptive, predictive, diagnostic, and prescriptive all wrapped up in one. And they work rather well. Just this past season, the LA Dodgers ranked #1 using the Moneyball formula and won the world series over the #2 ranked NY Yankees (see our blog on that).
For company sales growth, a set of Moneyball analytics exist that are also descriptive, predictive, diagnostic, and prescriptive: Value Gaps. A customer value gap score measures how well a company is meeting customer expectations across a set of key sales growth metrics, aggregated into gaps based on functional and emotional needs. Similar to how a team competes within its league, companies compete within their industry to out-smart and out-executive rivals.
This makes for some intriguing comparisons, for example: The Duke basketball team, the LA Dodgers, and Delta Airlines all have something in common.

Total Domination: The 2025 Duke Basketball Team
The KenPom rankings break down every team on a possession-by-possession basis by looking at their offensive and defensive performance every 100 possessions. A team’s Net Rating (also called Adjusted Efficiency Margin) is their offensive efficiency minus defensive efficiency, and calculates the points a team would outscore an “average” team. The more positive, the better the team is.
As of this week, Duke’s Net Rating is 39.62, which means they would win a game against an average D1 team by over 39 points. The system also takes a multitude of additional stats into consideration, such as adjusted tempo, strength of schedule (SOS), margin of victory, and even luck.
A higher Net Rating indicates more dominance over its rivals for that given season. In other words, the dominance is relative to that season’s “average” team. Duke’s current score is the highest ever for a CBB team.
Here’s something KenPom tells us as well: Duke and the next five teams are better this year than the 2023 UConn team that won the national championship. Take the 2025 teams for Houston, Florida, Auburn, Tennessee, or Alabama back to 2023, and each one is likely to beat UConn to win the national champions. And the 2024 UConn team, along with Houston and Purdue, is also likely to beat the 2023 UConn team.
The Power of Delta’s Customer Trust
KenPom analytics have revolutionized how college coaches build, recruit, and game plan with their teams. The system is designed to be predictive, rather than reflective, of a team’s performance. Its college basketball “Moneyball” scores are meant to provide a snapshot of how strong a team would be if it played that given day.
Sports teams compete within their league; Companies compete within their industry. KenPom’s NetRatings are similar to wRatings Value Gaps, as winners can be determined by comparing scores. When looking at any given industry, the scores identify which companies are meeting customer expectations better than their rivals.
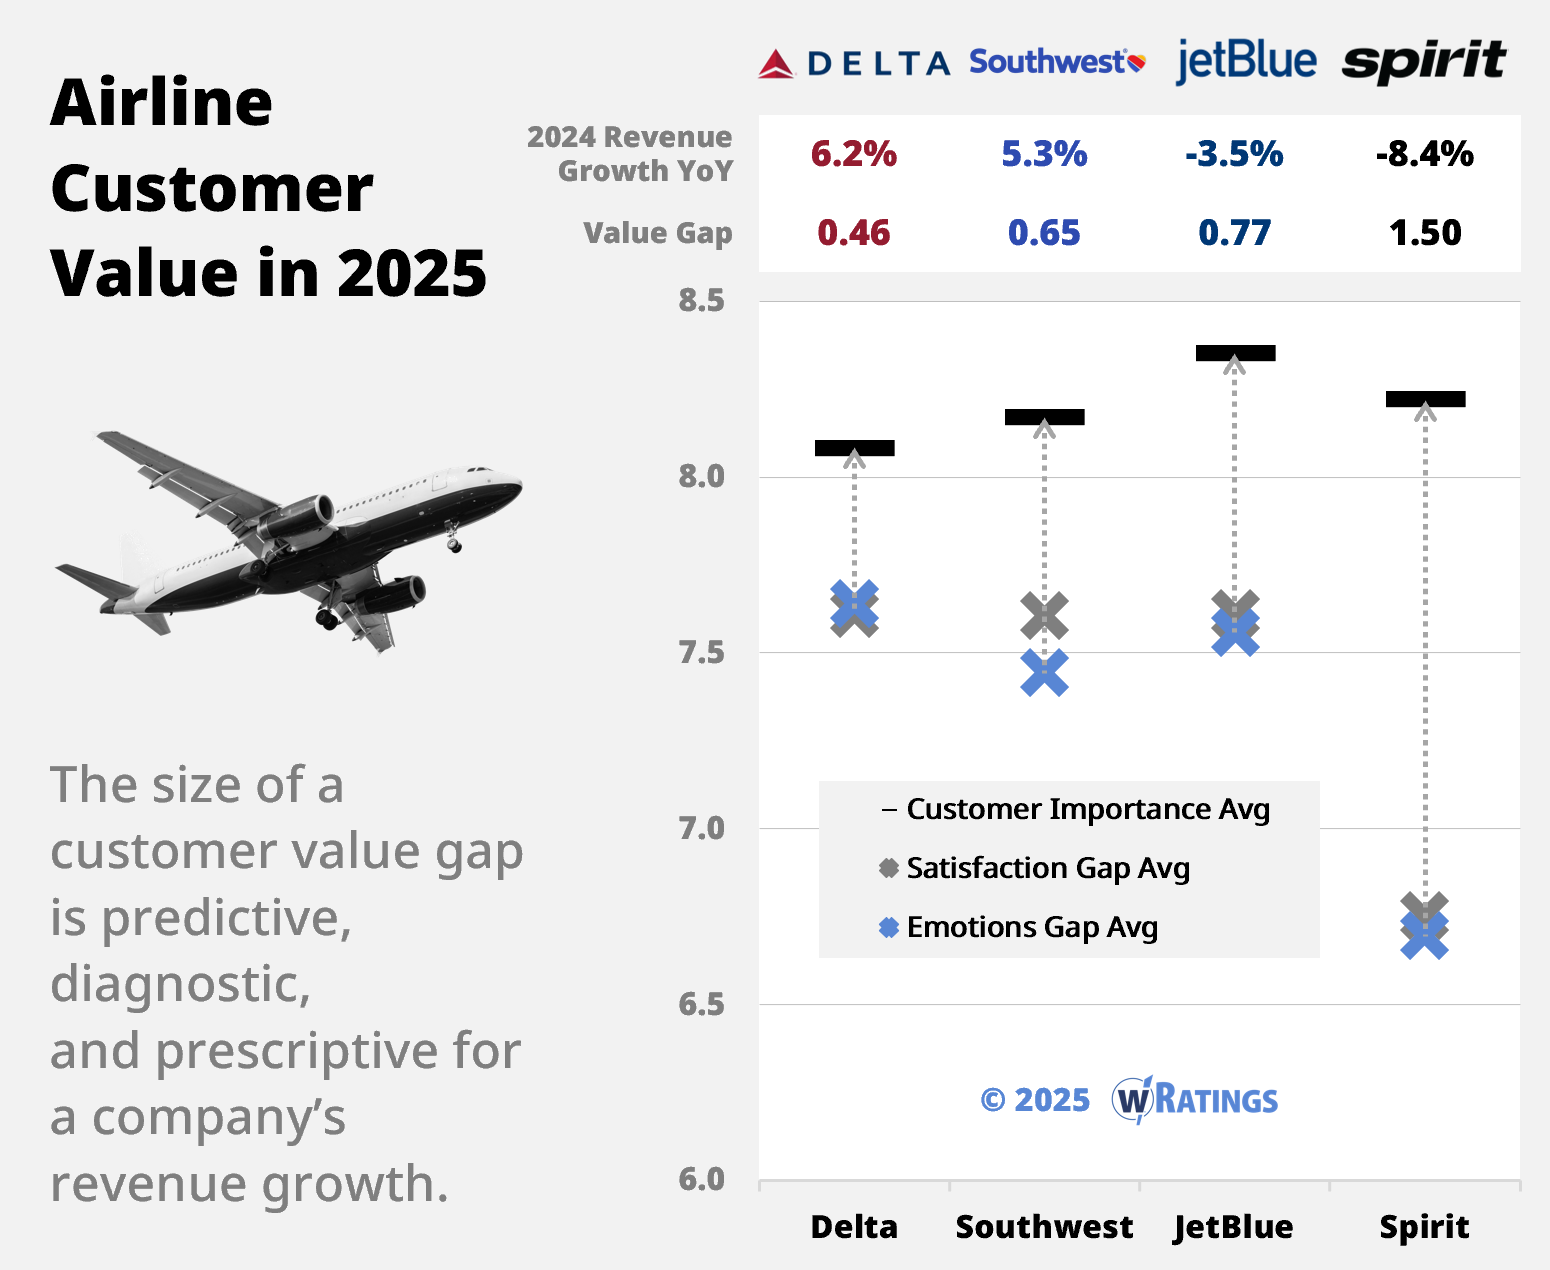
At the start of 2025 in the US airline industry, Delta is delivering more value to its customers than rivals Southwest, jetBlue, and Spirit. Consequently, Delta grew revenues year-over-year (YoY) at a higher pace (6.2%) than each of its counterparts in 2024 Q4. Creating more value for what the customer pays, quite literally.

Looking at their average satisfaction gap, Delta is less than a half-point away (0.47) from fully meeting customer expectations. Those expectations consist of 12 functional needs (e.g. Service Quality, Speed of Response, Safety, Pricing, etc.), which are predictive of revenue growth (see independent proof here). Southwest is not far behind Delta though, with an average satisfaction gap slightly more than a half-point (0.57).
But where Delta stands out with customers the most is in their emotional bonds. Delta is more than a quarter-point better at meeting the emotional ideals of customers than its rivals. Overall, the Delta customer experience is just superior – they make customers feel the way they want to feel when flying. Digging deeper into the analytics, a whopping 84% of its revenue growth contribution comes from one emotional area: Customer Trust.
Building and maintaining customer trust is a long-term commitment that requires consistent execution, something Delta emphasizes in their brand strategy. Even with its mass market approach, Delta has built a highly effective personal relationship with its customer base on par with Chick-fil-A, and only slightly lower than Apple customers in our benchmarking database.
Conversely, Southwest, Jetblue, and Spirit all struggle when trying to connect emotionally with its customers. This is particularly concerning to Southwest, as their customers are well-known for being as fanatical as Apple loyalists. But Southwest has hit difficult times, and is remaking the brand’s identity. Analytics in 2025 should be revealing as to whether their new strategy will work.
Winners Are Made
Whether you run a baseball team, college basketball team, or company, Moneyball analytics can help you understand what contributes most to winning and how to build a team to capture more wins. Today’s winners incorporate our analytics into their sales growth decisions.
If you’d like access to our Moneyball analytics and our benchmarking database, apply to become a wRatings Insider.
© 1999-2025 wRatings. All rights reserved / Privacy Policy


